Flash Flood forecast
A review of advances in flash flood forecasting

Comments on “Flash Flood Verification: Pondering Precipitation Proxies”
By JJ and Humberto who compared four threshold-based system for flash flood forecast accuracy: 1) MRMS dual-pol, radar-only QPEs; 2) ARIs of rainfall; 3) ratios of QPE to FFG; and 4) unit streamflow from the Sacramento Soil Moisture Accounting (SAC-SMA) mode.
It was found that the relative ETS values increased with the sophistication of the flash flooding products.

Flash Flood guidance
- The Flash Flood Guidance System (FFGS) provides real-time assessment and guidance products to more than 60 countries, serving nearly 3 billion people.
- The FFGS combines meteorology and hydrology data and concepts to support product utility for flash flood disaster mitigation on very large scales with high spatial and temporal resolution.
- The FFGS integrates remotely sensed data of land surface precipitation and of land surface properties from geostationary and polar-orbiting satellite platforms, reflectivity data from a variety of weather radar systems, and asynchronous precipitation data from ground-based automated precipitation gauges in order to produce assessments and short-term forecasts that support forecasters and disaster managers in real time.
- For each region, it also integrates mesoscale meteorological model forecasts with land surface model response to produce longer-term guidance products.
- The FFGS contains components and interfaces that allow real-time forecaster adjustments to products based on local last-minute field information and relevant forecaster experience.
- The article exemplifies the process of realization and evolution of the Flash Flood Guidance System (FFGS) from research in interdisciplinary fields to operations in diverse environments, and discusses lessons learned.
Flash Flood Index
The development of a flash flood severity index
A meta analysis of a workshop regarding how to determine flash flood severity index. They tentatively a quanlitative method to describe it.
| Category | Impact |
|---|---|
| 1-Minor flood | River/creek overflowing; cropland/yard/basement flooding |
| 2-Moderate flood | Street/road flooding; road closures |
| 3=Serious flood | Vehicles, homes and/or buildings inundated with water; road/bridge damage |
| 4-Severe flood | Vehicles and/or mobile homes swept away |
| 5-Catastropic flood | Buildings/Large infrastructures submerged; permanent homes swept away |
Assessment of Vulnerability to Extreme Flash Floods in Design Storms
In this article, the authors quantified the flash flood index by taking three terms into account: Rising Curve Gradient, Peak Discharge Magnitude, and Flood Response time. They also mapped Flashiness Index - Intensity - Duration - Frequency curves based on flood hydrograph but the shape is not similar to rainfall IDF curve.
\[RF=\frac{RK+RM+RT}{3}*100%\]
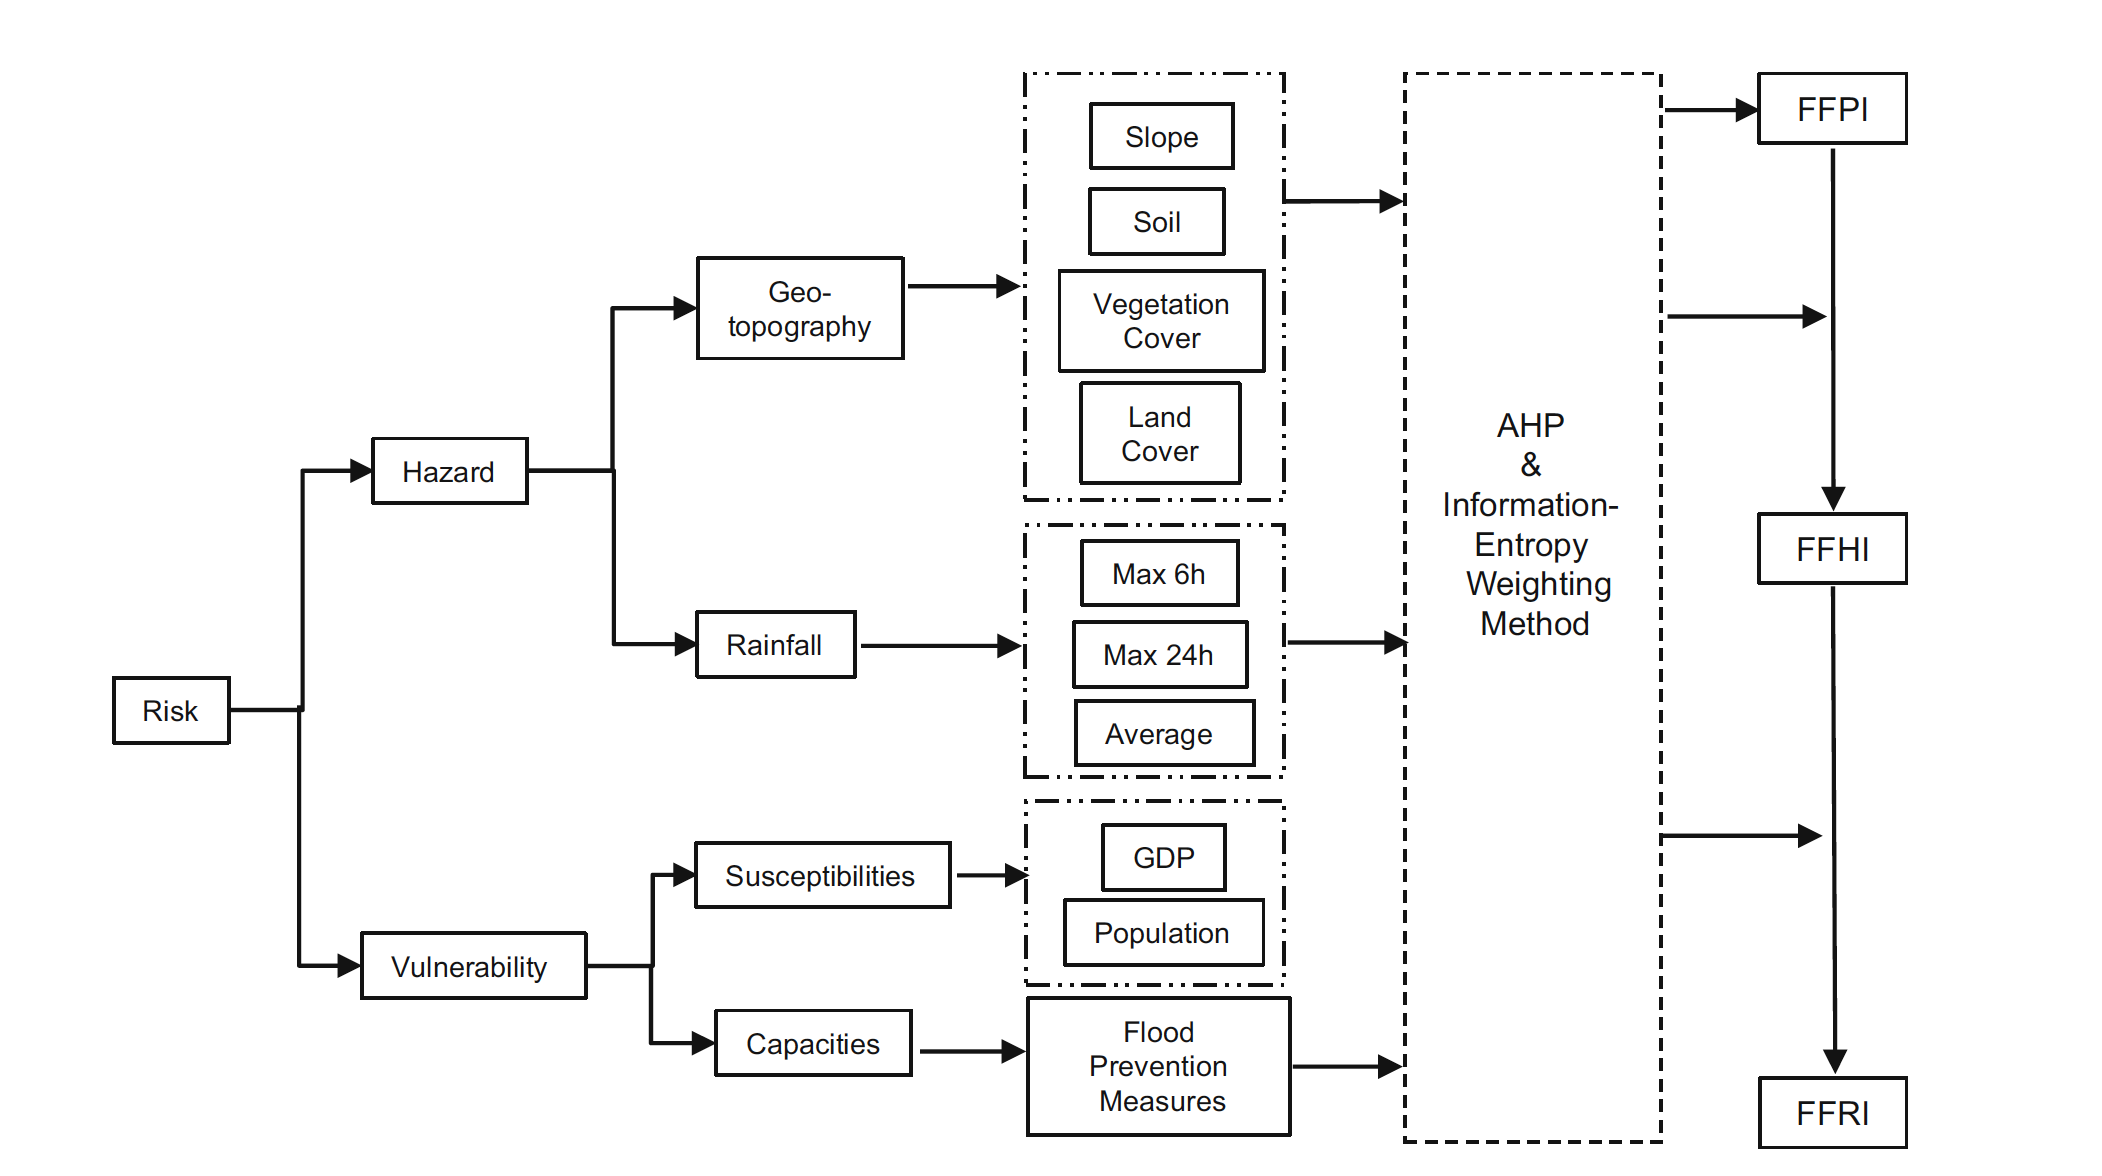
Zeng, Z., et al. (2016). “A cascading flash flood guidance system: development and application in Yunnan Province, China.” Natural Hazards 84(3): 2071-2093.
In this paper, the author proposed a framework which integrates data from precipitation, DEM, GPD etc. With these information, they take advantage of information entropy approach to assign different weights to each category. After that, they came up with an index map covering Yunnan province in China to assess the susceptibility of flash flood.
Mapping Flash Flood Severity in the United States
First study to derive the flashiness index over the continetnal US by utlizing machine learning trained on stream gauges.

On the Impact of Rainfall Spatial Variability, Geomorphology, and Climatology on Flash Floods - WRR
The author compared modelled flashiness indices to simulated flashiness indices and performed metrics analyzing the first-order dependence with rainfall variablity climatology and basin property.
The Flashiest Watersheds in the Contiguous United States
This article is titled “The Flashiest Watersheds in the Contiguous United States” and was written by Brianne K. Smith and James A. Smith. It was published in the Journal of Hydrometeorology. Key points:
- The authors identify the flashiest watersheds in the contiguous United States based on frequency of discharge peaks exceeding 1 m3 s−1 km−2.
- They used the entire digitized record of USGS instantaneous discharge data for all stream gauging stations with over 10 years of data.
- The flashiest basins in the contiguous United States are located in urban areas along a swath of states from the south-central United States to the mid-Atlantic and in mountainous areas of the West Coast, especially the Pacific Northwest.
- The authors focus on small watersheds to identify the flashiest cities and states across the country and find Tulsa, Oklahoma; Baltimore, Maryland; and St. Louis, Missouri, to be the flashiest cities in the contiguous United States.
- Thunderstorms are major agents for peak-over-threshold flood events east of the Rocky Mountains, and tropical cyclones play a secondary role, especially in Southeast. West Coast flood events are associated with winter storms.

Ombadi, M., et al. (2018). “Developing Intensity-Duration-Frequency (IDF) Curves from Satellite-based Precipitation: Methodology and Evaluation” Water Resources Research
In this paper, the author tried to develop IDF curve through 3 steps: 1. bias adjustment, 2. Point-to-Area transformation, 3. develop IDF curve with IR satellite data PERSIANN-CDR. The results are compared with NOAA Atlas 14.
The adjustment of bias is related to altitude because the author found the bias is increasing with elevation for IR satellite precipitation products.
Maddox, R. A. Chappell, C. F. and Hoxit, L. R. (1979). “Synoptic and Meso-$\alpha$ Scale Aspects of Flash Flood Events.” Foucs on Forecasting.
Author analyzed synoptic and mesoscale flash flood occuring in the US from 1973 to 77. He found that places frequently having flash flooding share the same features:
- Heavy rains were produced by convective storms. (from W to E, convective storms are more dominant)
- Surface dewpoint temperatures were very high.
- Large moisture contents were present through a deep trpospheric layer.
- Vertical wind shear was weak to moderate through the cloud depth.
Dowswell III, C. A., H.E. Brooks, R.A. Maddox (1996). “Flash Flood Forecasting: An Ingredients-Based Methodology.” Weather and Forecast(11): 560-581.
Key ingredients that affect flash floods:
- The heaviest precipitation occurs where the rainfall rate is highest for longest time.
- precipitation efficiency is important: the ratio of the mass of water falling as precipitation to the influx of water vapor loss into the cloud.
- Heavy rain rates are most often occur with deep convection - the atmosphere must be conditionally unstable and significant lift must occur to lift the airmass through the level of free convection (LFC).
- The heavy precipitation must remain quasi-stationary.
Leveraging machine learning for predicting flash flood damage in the Southeast US
Environmental Research Letters
The author attempted to train an ensemble ML models to predict the flash flood damages among which they also used ANN to fill the gaps of median household values for the U.S. citizens. They eventually achieved reasonably good result for their models. But I had some insights of it:
- For the binary classification, the author presented a ROC curve to demonstrate the accuracy but as they didn’t mention the distribution of the data sample, meaning that it could be biased because of the sample distribution;
- For the regression model, I’m wondering if train the network based upon the result of classfication would be better because it is a way to reduce trainable data and also people are not aware of which no damage caused in the event;
Flash Flood Risk Assessment in the Context of Economic Change Scenarios
The authors used a flood inundation model to retrospectively analyze one flash flood event and associate it with economic losses. They used GDP by different CMIP models to project future economic losses by a similar event.
The Paroxysmal Precipitation of the Desert: Flash Floods in the Southwestern United States WRR
- The article discusses a deadly flash flood event that occurred on September 14th, 2015 in Hildale, Utah. This event resulted in 20 fatalities and is considered the most deadly natural disaster in Utah’s history.
- The flood was caused by a hailstorm that intensified as it interacted with complex terrain and moved rapidly from southwest to northeast.
- The storm exhibited striking temporal variability and produced extreme precipitation over Maxwell Canyon tributary of Short Creek and a small portion of the East Fork Virgin River basin.
- Polarimetric radar observations were used to analyze the rainfall characteristics of the storm. Periods of extreme rainfall rates were characterized by KDP signatures of extreme rainfall in polarimetric radar measurements.
- The climatology of monsoon thunderstorms that produce flash floods exhibits striking spatial heterogeneities in storm occurrence and motion.
Flash Flood Warning and Communication
Rebecca Morss at NCAR who wrote a lot of papers about extreme weather risk communications through surveys and mental models, below listed are two:
- How do people perceive, understand, and anticipate responding to flash flood risks and warnings? Results from a public survey in Boulder, Colorado, USA
- “Know What to Do If You Encounter a Flash Flood”: Mental Models Analysis for Improving Flash Flood Risk Communication and Public Decision Making
- Flood Risk, Uncertainty, and Scientific Information for Decision Making: Lessons from an Interdisciplinary Project