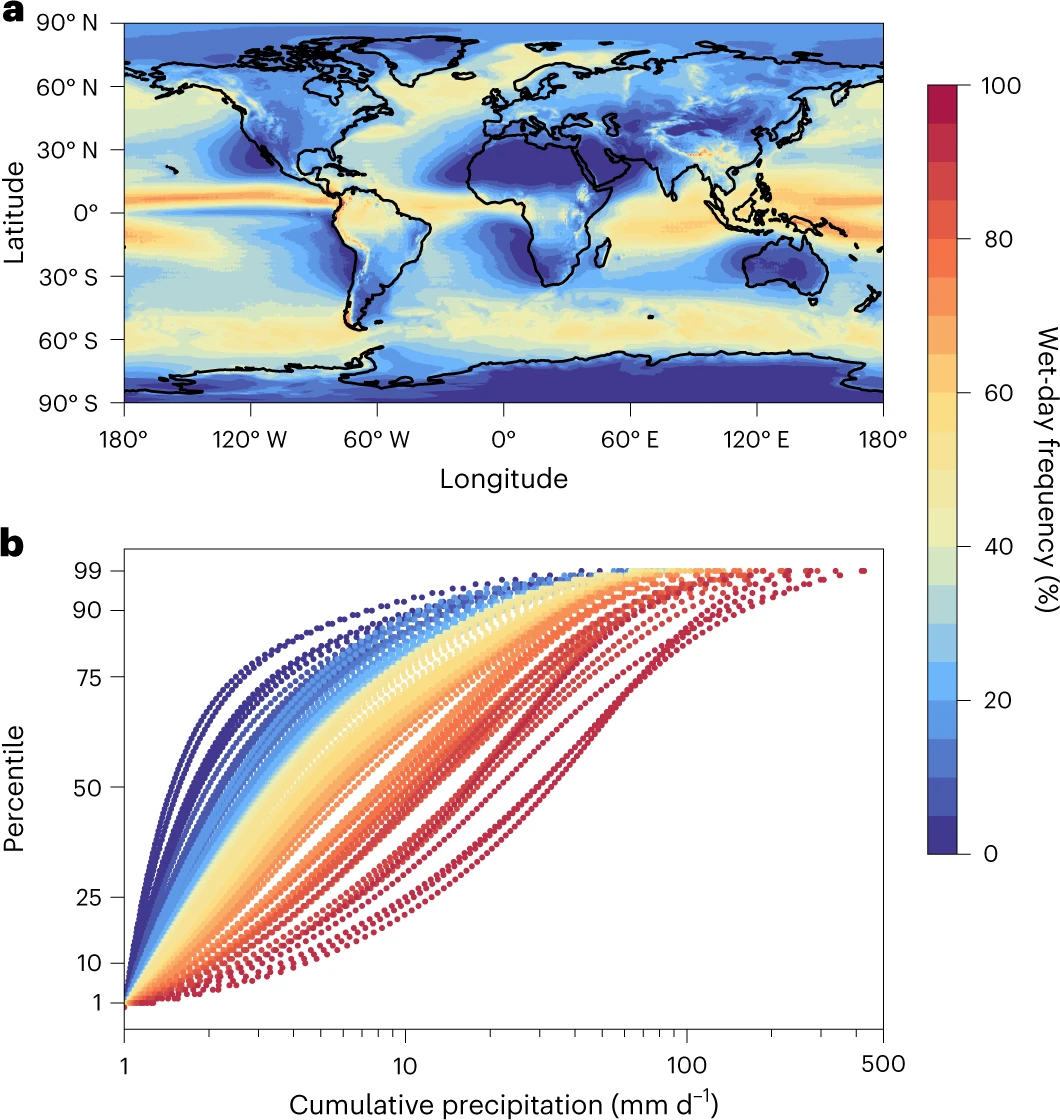
long-term extreme precipitation
West US
Main driving agent is the Atmospheric river
Despite generally lower hourly intensities, precipitation totals along the U.S. West Coast (USWC) are comparable to those in southeast U.S. (SEUS). Storm durations, more so than hourly intensities, strongly modulate precipitation-total variability over the USWC, where the correlation coefficients between storm durations and storm totals range from 0.7 to 0.9. Atmospheric rivers (ARs) contribute 30–50% of annual precipitation on the USWC and make such large contributions to extreme storms that 60–100% of the most extreme storms, i.e., storms with precipitation-total return intervals longer than 2 years, are associated with ARs.
US
ENSO and Wintertime Extreme Precipitation Events over the Continuous US
- EOFs are used to analyze daily precipitation fields with compositing 500-mb heights
- study domain CONUS but special focues on coastal regions
- From PCs to infer large flood events;
- Inspect how ENSO impact extreme precipitation (Gumbel PDF)
Prat, O. P., & Nelson, B. R. (2015). Evaluation of precipitation estimates over CONUS derived from satellite, radar, and rain gauge data sets at daily to annual scales (2002–2012). Hydrology and Earth System Sciences, 19(4), 2037.
The author adopts adaptive absolute rain rates to define extreme (i.e., WMMD=17.3 mm/day, 2 in/day, 4 in/day).
Authors investigated the observed ARI (Annual recurrence interval) of extreme rainfall versus NOAA Atlas 14 product to show the trend.
The motivation is to amplify that Evidence for intensifying rainfall extremes has not translated into “actionable” information needed by engineers and risk analysts.
China
Spatial and temporal variation of extreme precipitation over the Yangtze River Basin
-
Extreme precipitation analysis in Yangtze River in China a. Long-term trend is detected from non-parametric Sean’s method b. REOF (rotated EOF) is used to find both spatial and temporal variability c. wavelet transform to decompose time series into time-frequency space to discover the periodicity;
-
Extreme events is defined as daily precipitation exceeding 95th percentile
Miao, C., H. Ashouri, K. Hsu, S. Sorooshian, and Q. Duan, 2015: Evaluation of the PERSIANN-CDR Daily Rainfall Estimates in Capturing the Behavior of Extreme Precipitation Events over China. J. Hydrometeor., 16, 1387–1396, https://doi.org/10.1175/JHM-D-14-0174.1
The main purpose of this study is to analyze the climatology of long-range rainfall simulation, particularly for PERSIANN-CDR, and also to validate the accuracy of it.
Three indices are used to perform evaluation: 1. percentile indices RR99, RR95; 2. Absolute threshold indices (R20mm etc.); 3. Maximum indices (Rx1day, Rx5day etc.)
The conclusion is that overall PERSIANN-CDR shows an agreement with ground observations for long-term climatological studies except for some reserved regions like Tibetan Plateau.
Globe
-
The dataset is from HadEX2 with Rx1day ranging from 1900 to date globally;
-
Annual maximum daily precipitation is analyzed in this study with two ways of testing the trends: (1) Mann-Kendall test; (2) GEV;
-
In their analysis, the significance is calculated based on a resampling procedure;
-
Near surface temperature is examined to test the relationship with extreme precipitation: they found most positive associations;
Global trends in extreme precipitation: climate models versus observations (HESS)
-
different scenarios in CMIP5 model against HadEX2 are compared in terms of the extreme precipitation trends: most of the results showing positive extreme precipitation trends. Linear regression slope and Mann-Kendall test are used in this study.
-
different percent of change under global warming are tested to project the potential increase in extreme precipitation.
- Normalized precipitation (remove climatological mean and divided by standard deviation)
- EOF analysis: common EOF (cEOF) to study the common spatial patterns in the GPCP and CMAP. To perform this, GPCP and CMAP are concatenated along time dimension and then separated.
- An interesting plot with x the month and y axis the year. In between is the spatial correlation Due to the variability nature of precipitation, the EOF modes only explain little amount of variations.
In this article, the authors investigated the trends and stationarity for extreme rainfall in Brazil.
They used three modes of GEV analysis: 1) stationary GEV; 2) non-stationary GEV with varing location parameter; 3) non-stationary GEV with varying both location and scale parameters.
They performed grid-based analysis towards stationarity check.
Rainfall statistics, stationarity, and climate change
This work is published in PNAS.
The dataset used in the global land surface precipitation is GPCC Version 5.
They set criteria to check stationarity: 1) the mean of annual precipitation is constant and 2) the autocorrelation only depends on the relative position in the time series.
This is a work to show a phrase that “when it rains more often, it rains harder”. They used satellite precipitaiton products as well as reanalysis products ERA5. They provided some speculations about this statement by using CAPE to explain that regions with higher updraft tend to rain more often and harder.
How to define extreme rainfall events?
Stevenson, S.N. and R.S. Schumacher, 2014: A 10-Year Survey of Extreme Rainfall Events in the Central and Eastern United States Using Gridded Multisensor Precipitation Analyses. Mon. Wea. Rev., 142, 3147–3162, https://doi.org/10.1175/MWR-D-13-00345.1
The author constructed extreme rainfall events alike IDF curve but with radar gridded product, determining 100yr/50yr return plus the time accumulation (1h,6h,24h) with 10 years of data.
They analyzed the distribution of extreme rainfall events in terms of seasonality, diurnal effect, and topography based on these categories.
Zhou, Y., Nelson, K., Mohr, K. I., Huffman, G. J., Levy, R., & Grecu, M. (2019). A spatial‐temporal extreme precipitation database from GPM IMERG. Journal of Geophysical Research: Atmospheres
In this article, the authors proposed a way to identify extreme precipitation events with following approaches:
- construct inventory (EXT) from grid exceeding the mean precipitation plus 2.5 standard deviation;
- find the maximum in the EXT, and search for the neighboring grid (d<dis_threshold;t<time_threshold);
- loop through all grids in the EXT
- include light rain within the threshold basis;
- repeat 2 until all grids in EXT are examined
The authors analyzed the US extreme precipitation rates, attributed to jet streams and cutoff lows. Over 95% of 1-h annual maximum precipitation along west coast coincident with jet stream while 30% of interior western US is impacted by cutoff lows.
Intense precipitation evaluations
AghaKouchak, A., Behrangi, A., Sorooshian, S., Hsu, K., and Amitai, E. ( 2011), Evaluation of satellite‐retrieved extreme precipitation rates across the central United States, J. Geophys. Res., 116, D02115, doi:10.1029/2010JD014741.
In this paper, authors addresses the extreme precipitation estimation with four satellite products. The metrics used in evaluating these satellite performance can be considered. Also intriguing, PERSIANN shows less bias than TMPA in the results from a purely data exploratory perspective.
Climate change and extreme precipitation
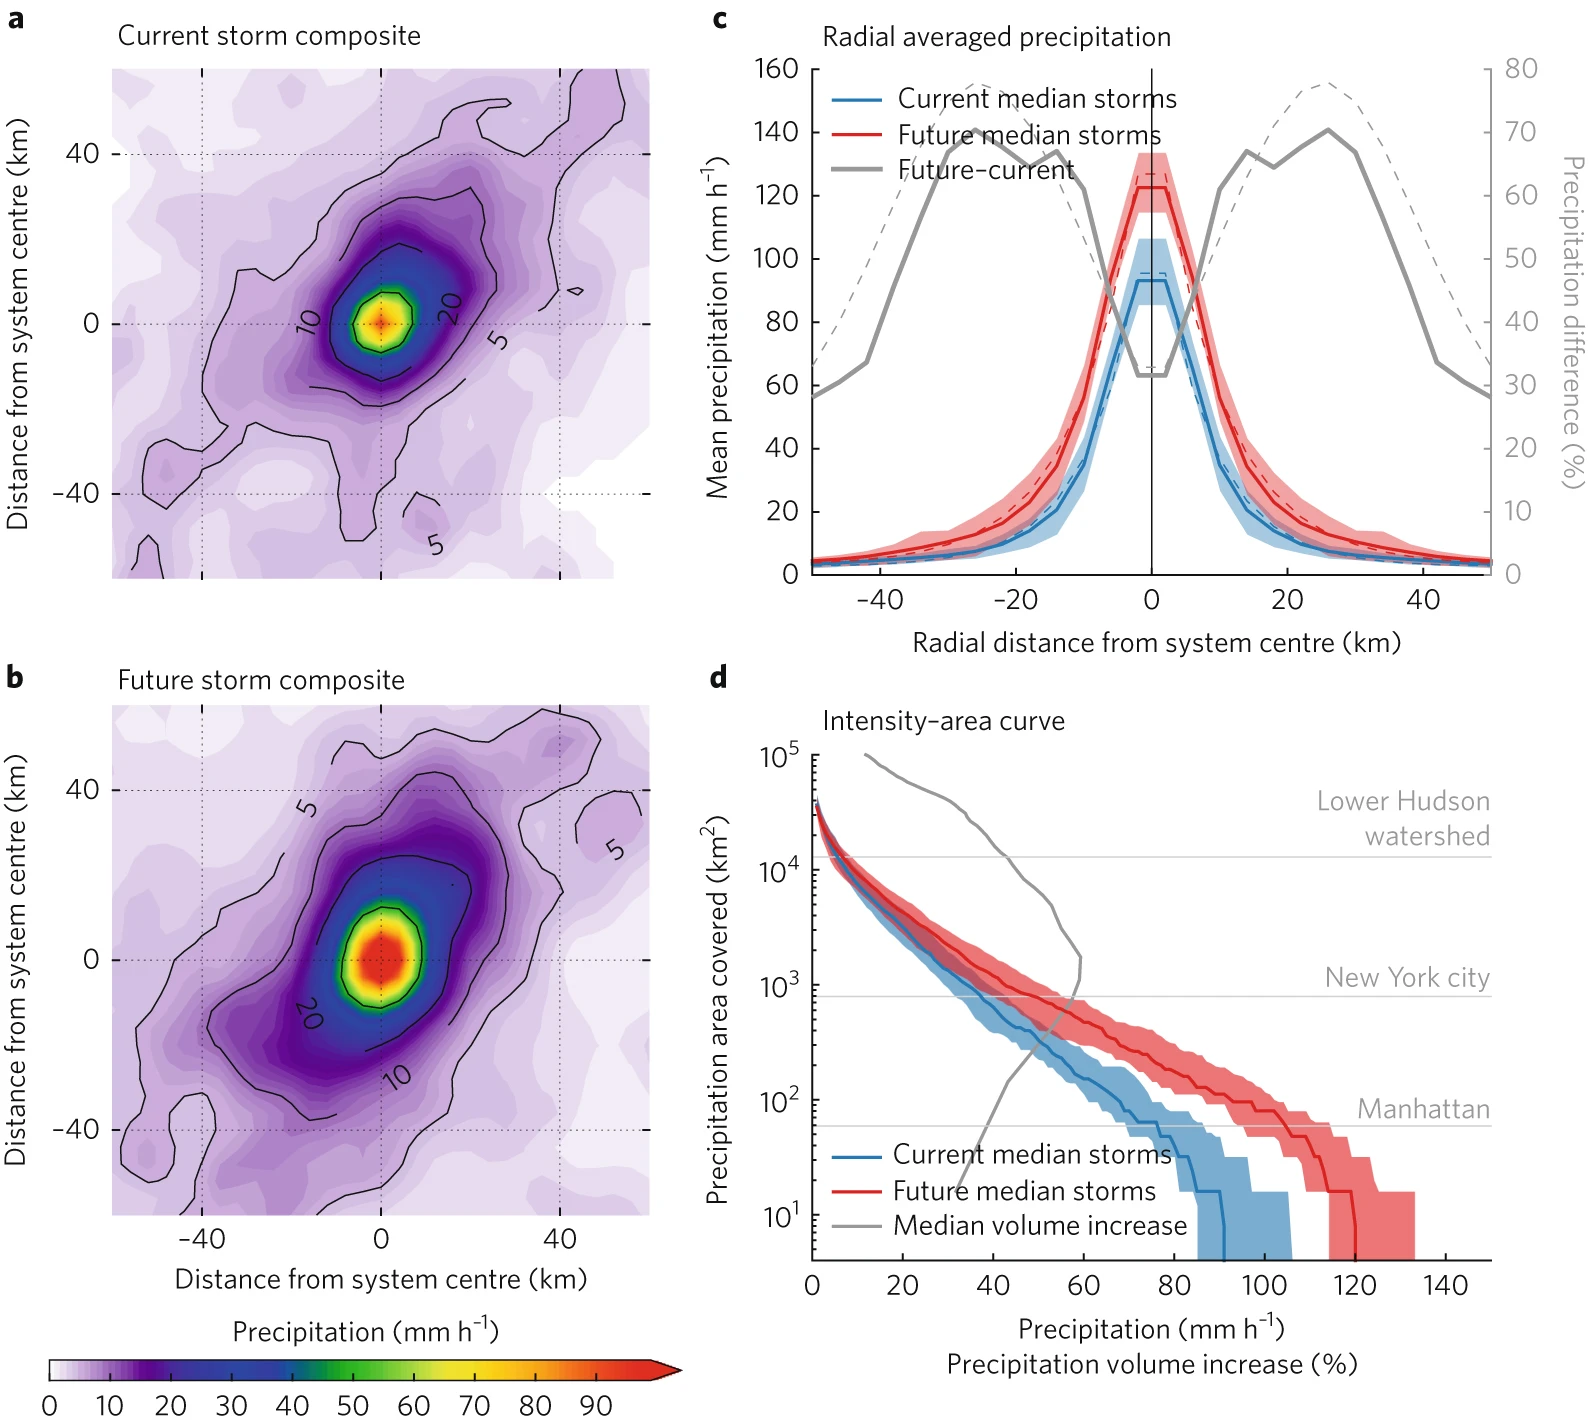
Increased rainfall volume from future convective storms in the US (Nature Climate Change)
The authors used the CONUS-I dataset to diagnose future extreme precipitation changes from the perspective of MCSs by using a storm tracking algorithm object-based diagnostic evaluation (MODE).
What is interesting here is that they plotted the precipitation in terms of intensity-area curve, from which one can tell what the change would be for the storm characteristics. Finnaly, to attribute changes to warming environment, they compared the cloud top temperature for concatenated events.
Monitoring and understanding trends in extreme storms (BAMS)
Extreme precipitation changes are analyzed using trustworthy rain gauges over the US since 1948. About 76% of all stations showing increasing, among which 15% shows significant increase. From the central United States to the North Atlantic, these exhibit a high degree of spatial coherence.
- Hurricane/TC activities are found to increase according to Power Dissipation Index. Connections with large scale oscillation and Atlantic Cyclones are a matter of debate. In addition, anthropogenic emissions and volcanic activities are less certain in terms of their roles in contributing to extreme precipitation.
- Winter storms are discussed with ENSO, North Atlantic Oscillation, Arctic Oscillation.
Future changes to the intensity and frequency of short-duration extreme rainfall (Rev. Geophys.
A comprehensive review on climate change studies including theoritical explainations.
A common conclusion to these studies is that subdaily extreme rainfall is intensifying more rapidly than rainfall measured at daily time scales. This could have significant societal consequences, since floods produced by short-duration rainfall (often referred to as “flash” floods).
- Hourly precipitation with temperature scaling ratio is discussed.
- Moisture availability is discussed - Trends in precipitation extremes in the United States also have been linked to precipitable water changes
- Influence of Rainfall Type on Scaling - convective extremes are by nature more intense and have shorter durations than large-scale rainfall and (b) the proportion of extreme rainfall which is convective increases with atmospheric temperature. higher CC scaling is found for convective system.
- Cloud dynamics play a role in extreme precipitation changes.
- Clausius-Claypean - In some dry areas, scaling appears to be lower than CC
- Insights from Global Climate Models - Current convection parameterization schemes are not able to represent rainfall from storms that continually regenerate in the same location as a result of the storm dynamics or storms that are locally organized because of topographical influence.
- Rainfall-flood association - it discusses how to define extreme rainfall
- Relationship between rainfall duration and catchment size - smaller catchments are sensitive to short but intense bursts of rainfall, sometimes lasting only an hour or less, whereas larger catchments are sensitive to extended periods of heavy rainfall lasting for several days or longer.

Resilience to Extreme Rainfall Starts with Science BAMS
In this article, the authors call for attention to update storm database to guide building resilient society. The out-of-date NOAA Atlas 14 poses hurdles to design up-to-date flood infrastructure and resilient measures.
This study benchmarks global climate model output (CESM2-LE) 24-hr precipitation on NOAA Atlas 14 to show the changes in extreme precipitation. It presents a spatially varied differences in extreme precipitation changes.

Declining tropical cyclone frequency under global warming Nat Climate Change
The authors reconstructed long-term TC frequency to show a decreasing trend in most of regionos, especially during the periods of post-industrialization

Beyond findings, the authors attributed the changes to (1) mid-tropospheric upward mass flux, (2) environmental vertical wind shear, and (3) saturation deficit (mid-tropospheric dryness).
Hydroclimatology
Hydroclimatic trends during 1950–2018 over global land
the authors updated hydroclimatologic variables: precipitation, streamflow, evaporation from the period 1950 to 2018. He specifically analyzed the historical trends over global land surface.
Dryness-wetness transition (seesaw)
The Role of Anthropogenic Forcing in Western United States Hydroclimate Extremes
They defined a index called hydroclimatic intensity HYINT which is a product of mean annual precipitation intensity and mean annual number of consecutive dry days during each dry spell.
The Fraction of Attributable Risk (FAR) framework is used for attributing the extreme HYINT event.