
Getting a better understanding of precipitation can benefit us to provide more accurate forcing data for hydrologic models. Towards the data explosion era, we have multi-sources of rainfall capturing devices, e.g., ground-based rain gauges, radars, microwave links, and satellites. On the other hand, how to utilize these multi-sources of data becomes a spot for researchers. In this context, Triple Collocation (TC) has been proven to be a powerful statistical tool to evaluate three independent dataset, and also been widely used in hydrometeorology. Since each data source suffer more uncertainties from extreme rainfall events, e.g., hurricane, tropical cyclones, and no other previous work focuses on evaluating the performance of the rainfall data, we can thus cooperate with TC method as a tool to perform such analysis.
The three independent data been used in our study involve: (a) National Center for Environmental Prediction (NCEP) 4km-gridded-gauge-only product. (b) Multi-Radar Multi-Sensor (MRMS) radar-only QPE. (c) Integrated Multi-satellitE Rainfall retrieval for GPM (IMERG) V06B Final w/o calibration product.
We collected four extreme rainfall events include: (a) Hurricane Harvey (2017); (b) Storm Bill (2015); (c) Storm Cindy (2017); (d) Storm Imelda (2019).
In our study, we analyzed the rainfall field in the most impacted area by Hurricane Harvey and coincidently, these four events share the anagulous impacted area, which provides a testbed for performing different scales of analysis.
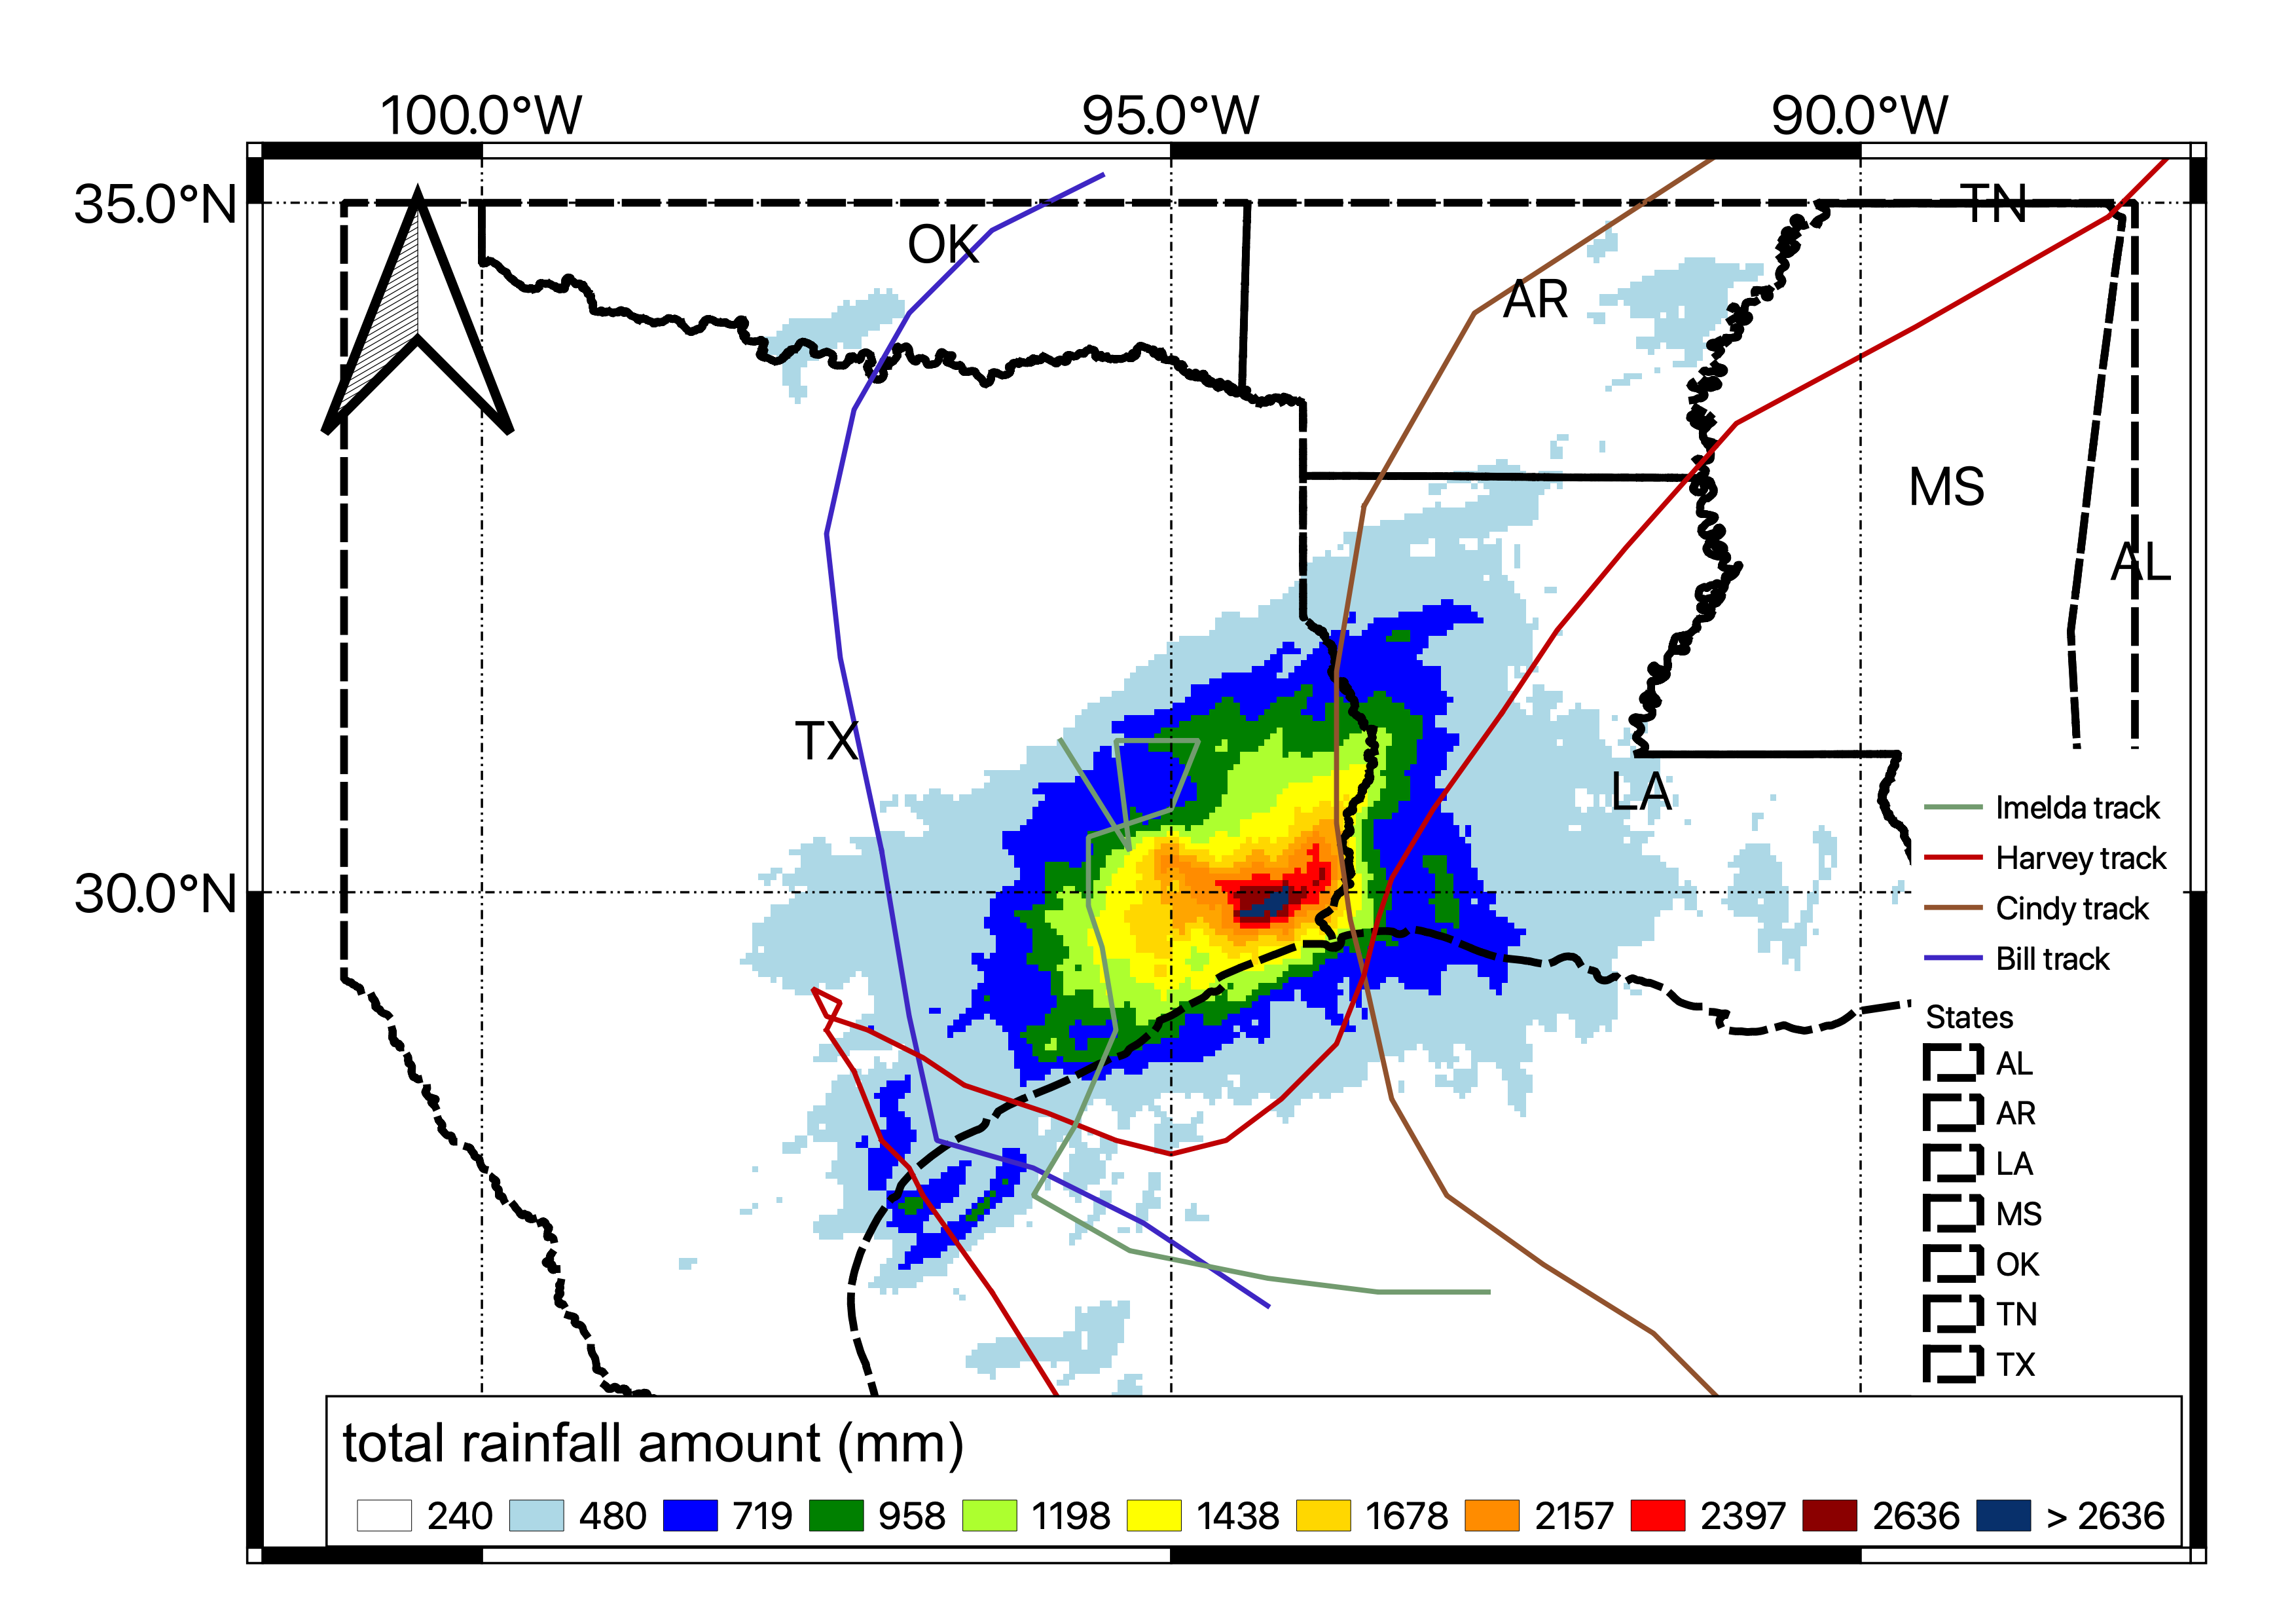
Fig.1 Study domain
In the results, we present from an overview and then seperate Harvey with special concern because of its severity, and at last, the core region of Harvey is disaggregated to specifically analyze the performance.
In Fig.2, it illustrates the rainfall field captured by different products for the four events cancatenanted together. MRMS captures the most rainfall.
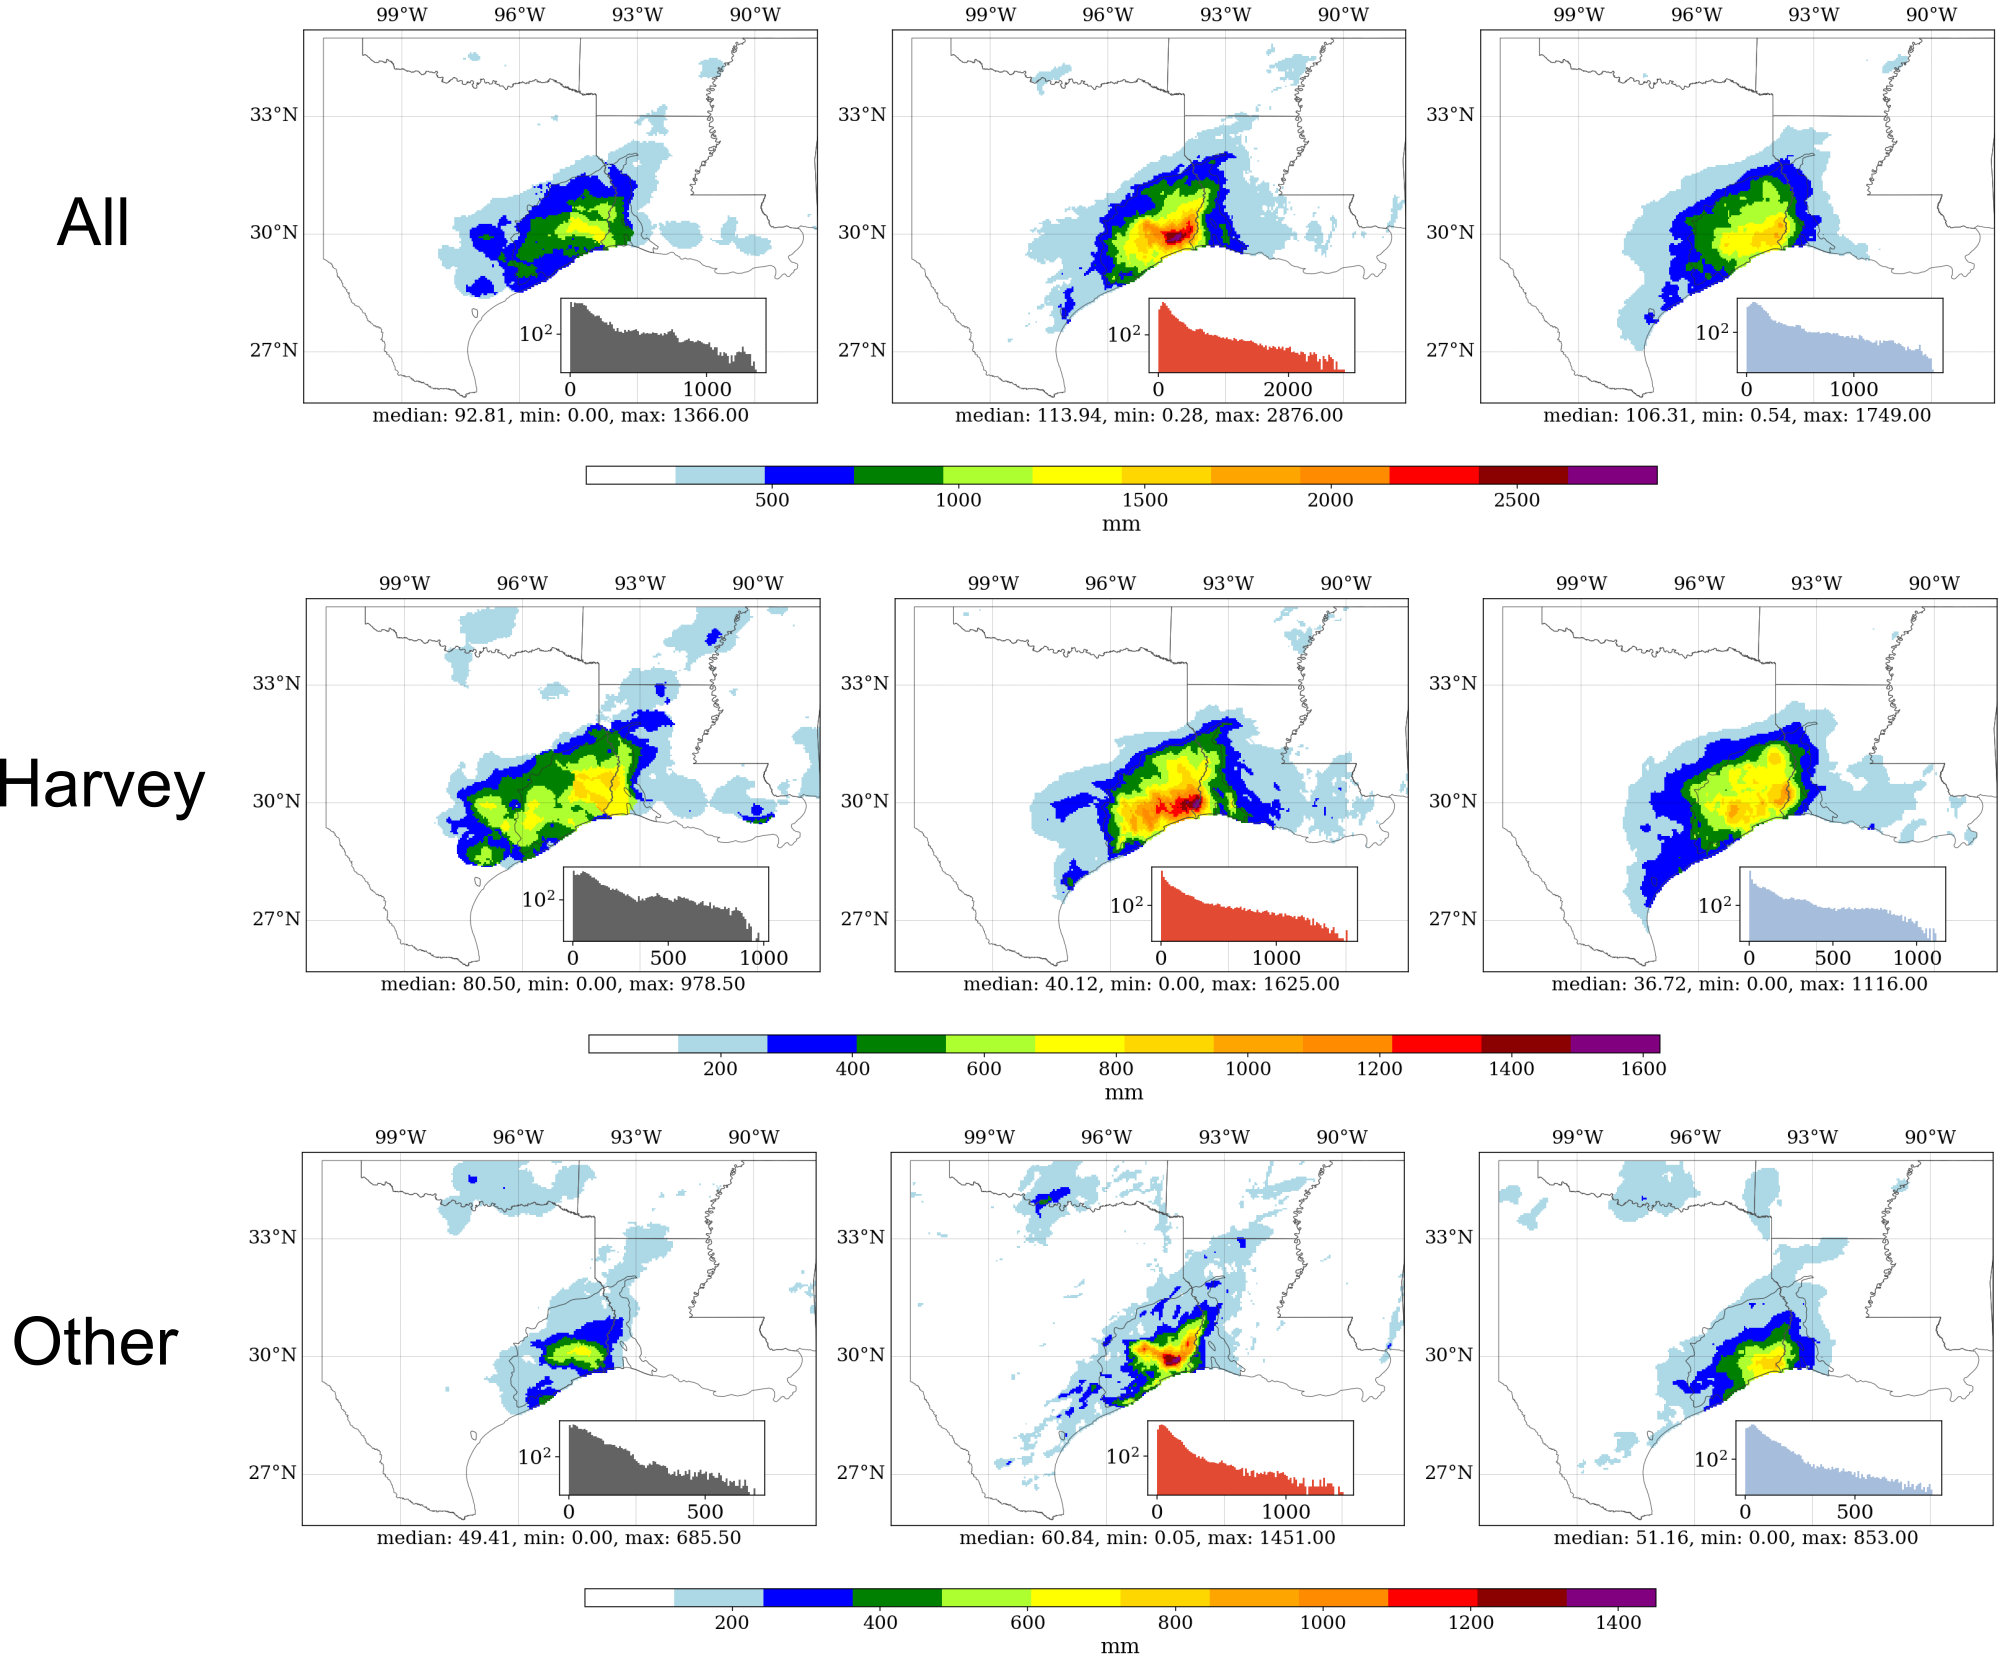
Fig.2 Total rainfall field for three scales and products.
In Fig.3, it shows the TC results for each product and three cases. From the results, we found MRMS always exhibites less uncertainties than the other two, and follows IMERG, NCEP.
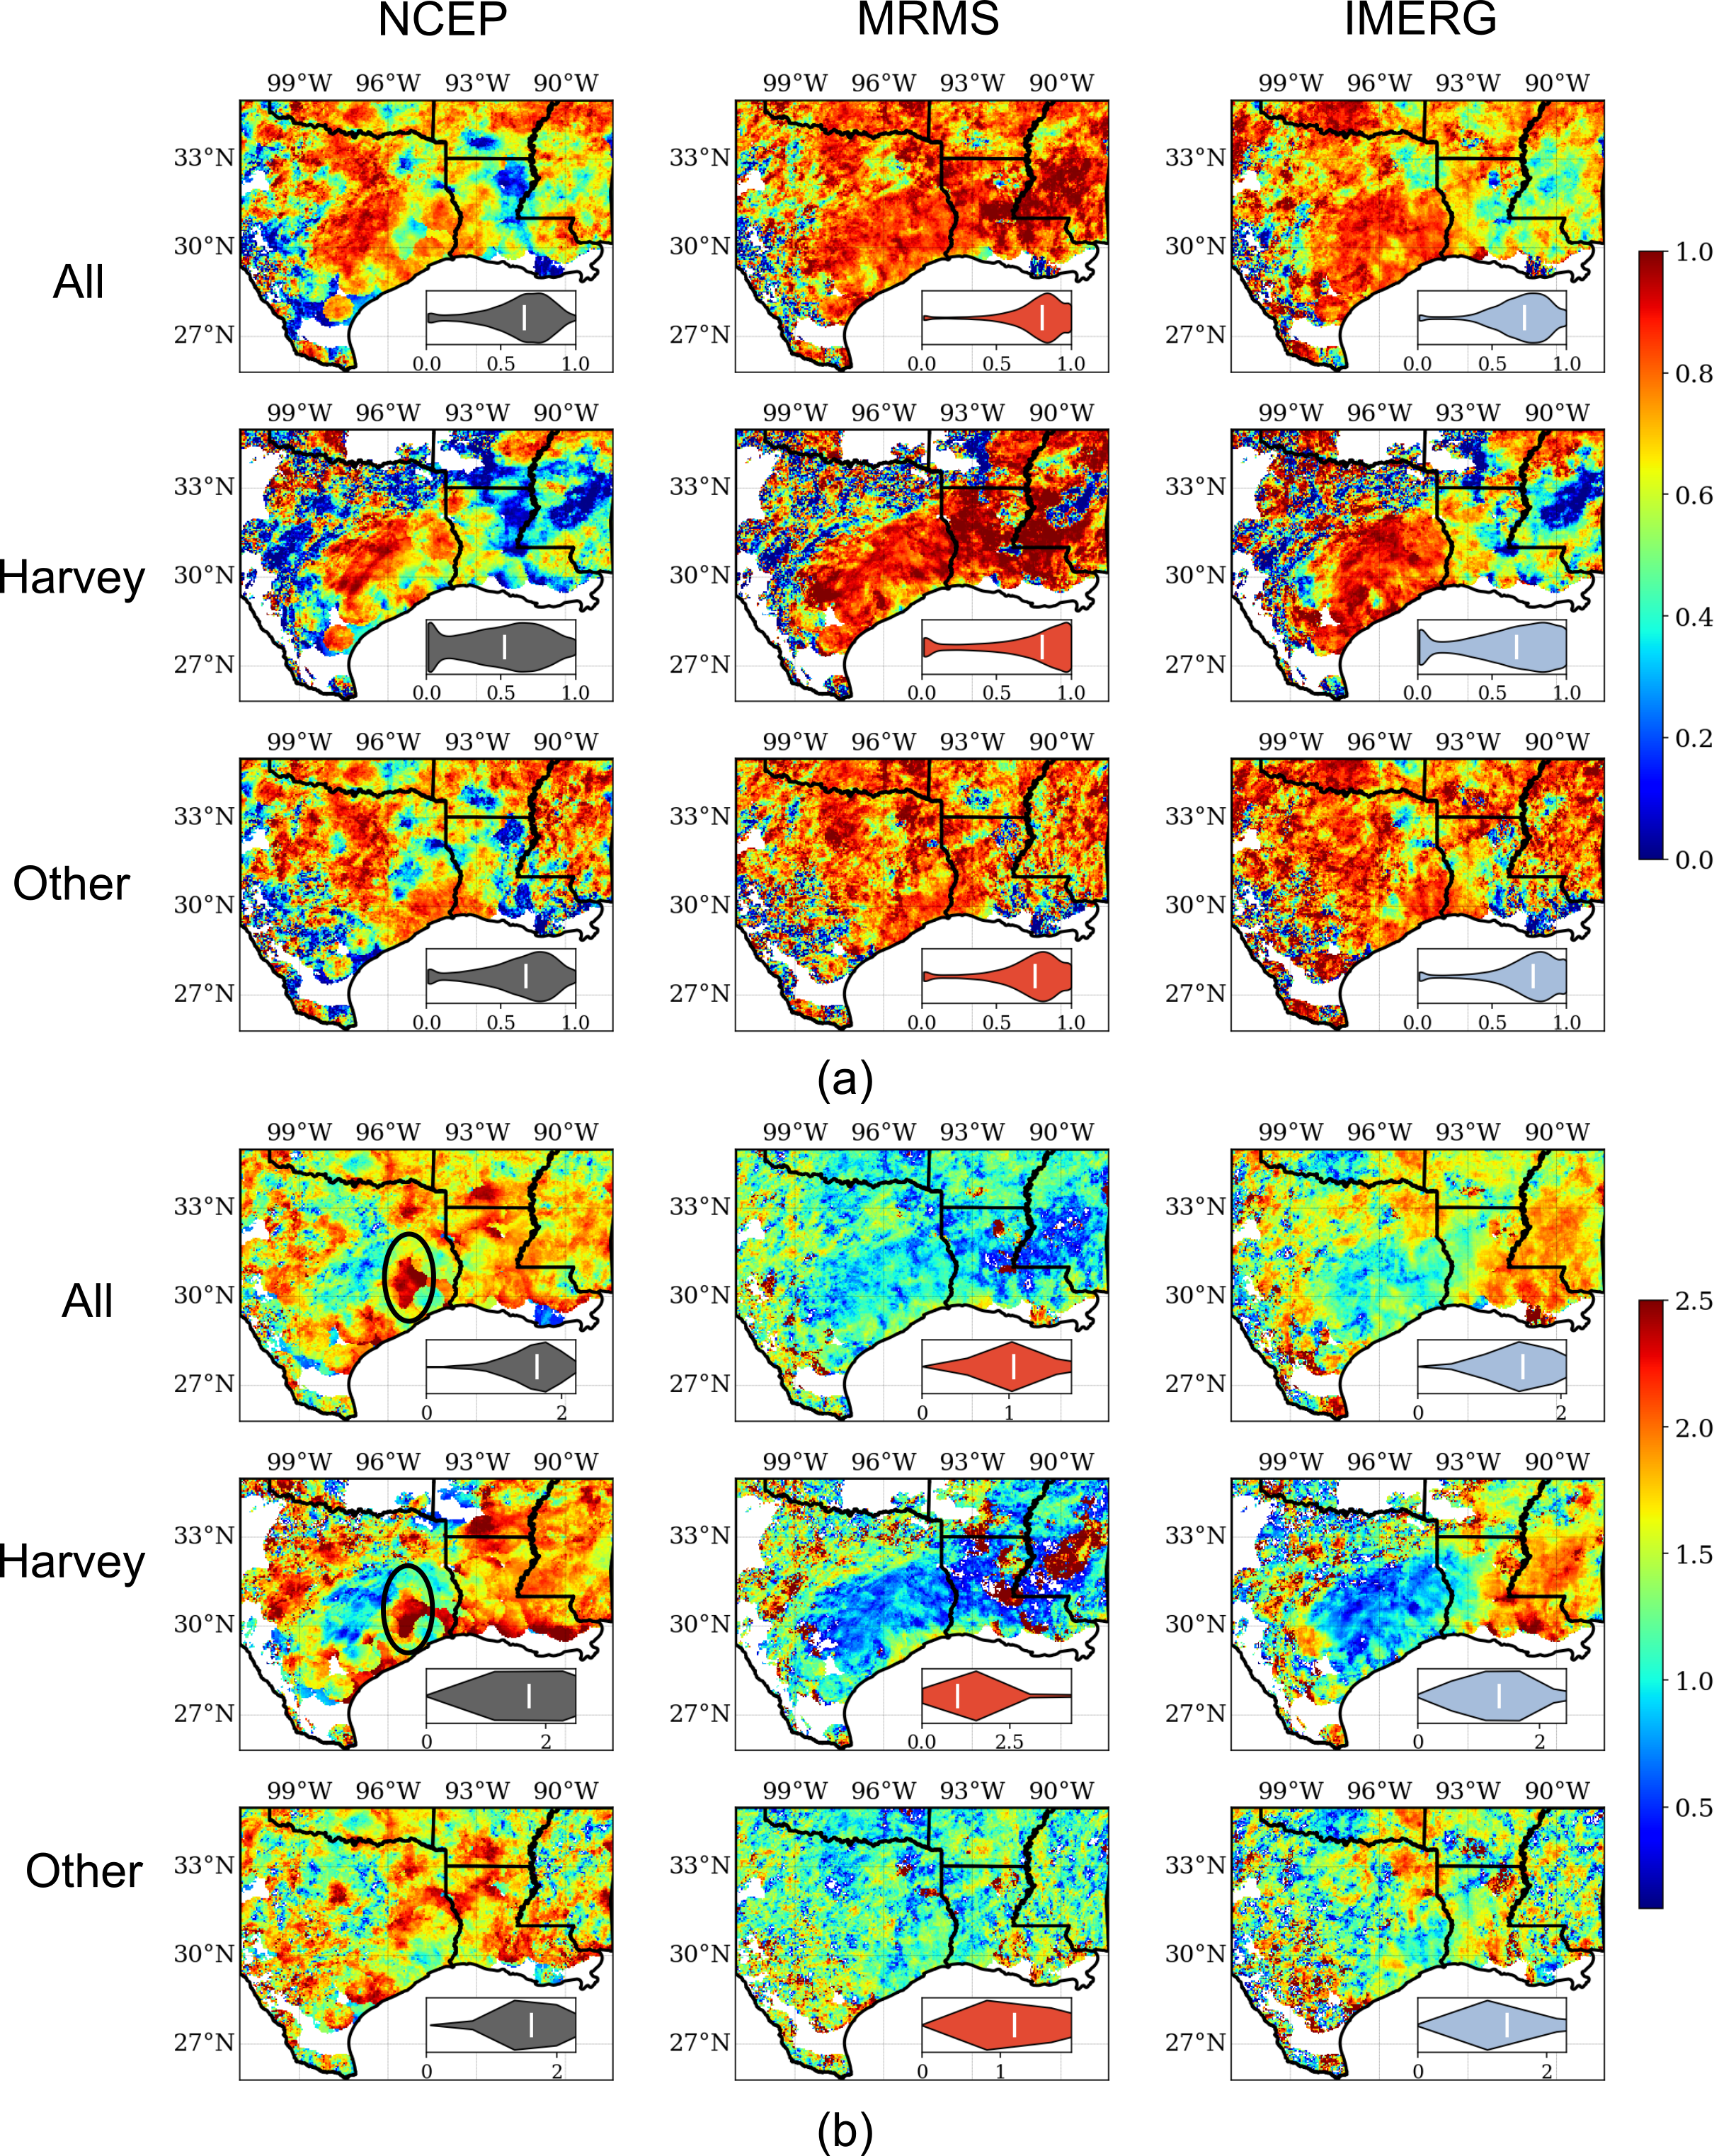
Fig.3 RMSE and CC (by TC) for three scales and products.
In Harvey case, we present the evolution of TC results as rainfall amount in Fig. 4. Thus, we can observe that MRMS is the most stable and robust one; IMERG experences higher uncertainty in the lower range and NCEP is always lower than the other two.
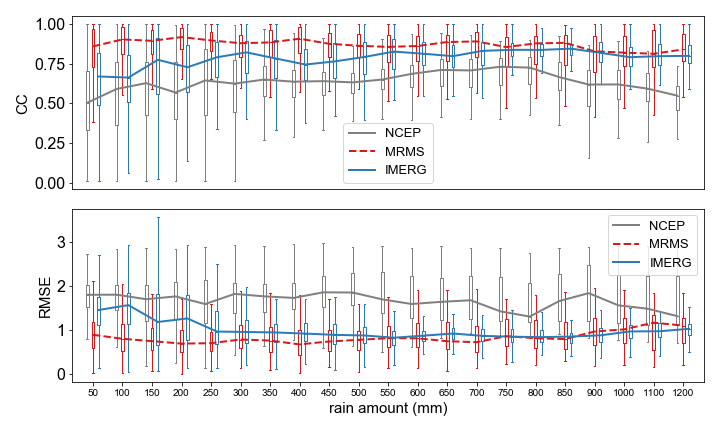
Fig.4 RMSE and CC (by TC) changes with rainfall amount.
To emphasize on more severe regions, we seperate the core region based on the 400 mm rainfall isoline (apx.60mm/day), and the boxplot of RMSE and CC for each isolated region is in Fig.5. metrics in core region gets some amounts of improvement except for NCEP because it filters out noises caused by limited rainy samples and logarithmic transform of little rainfall. NCEP improvement is superseded by the degradation of the fate of gauge-based observations e.g., wind-undercatching, splash of water etc.
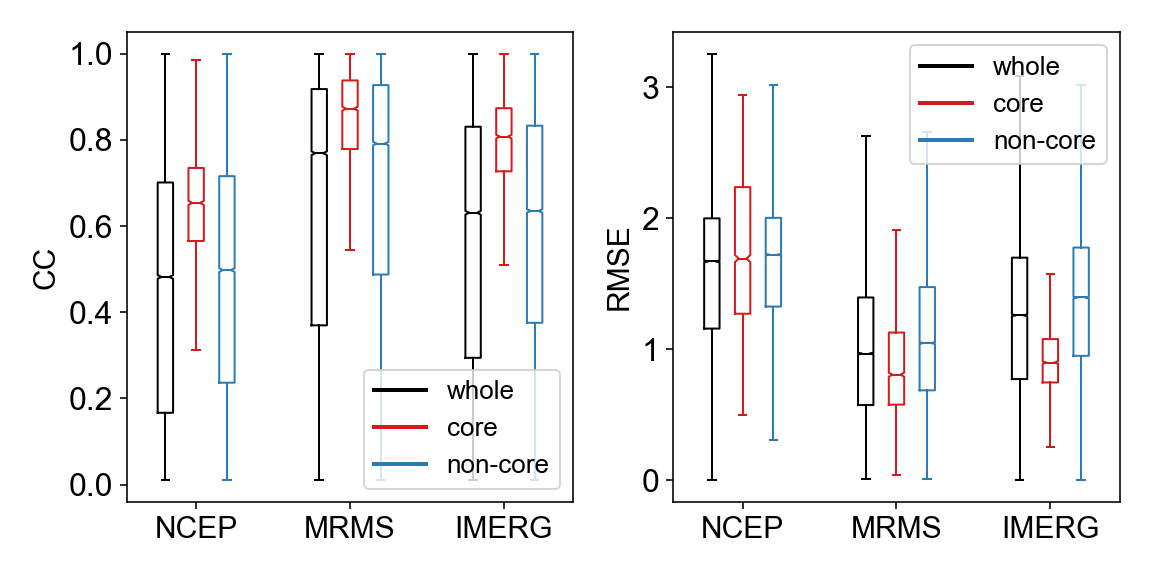
Fig.5 RMSE and CC (by TC) within three different domains.
To figure out why NCEP performance degrades in the core region, the time series plot unveils the answer as in Fig.6 because the grey window highlights when NCEP stop recording data while the other two observations continuously record. And also the other two devices have some deficiencies. For instance, MRMS have some anamalous signals in red window, and IMERG cuts off at 60 mm/hour due to its inherent sensor limitations.
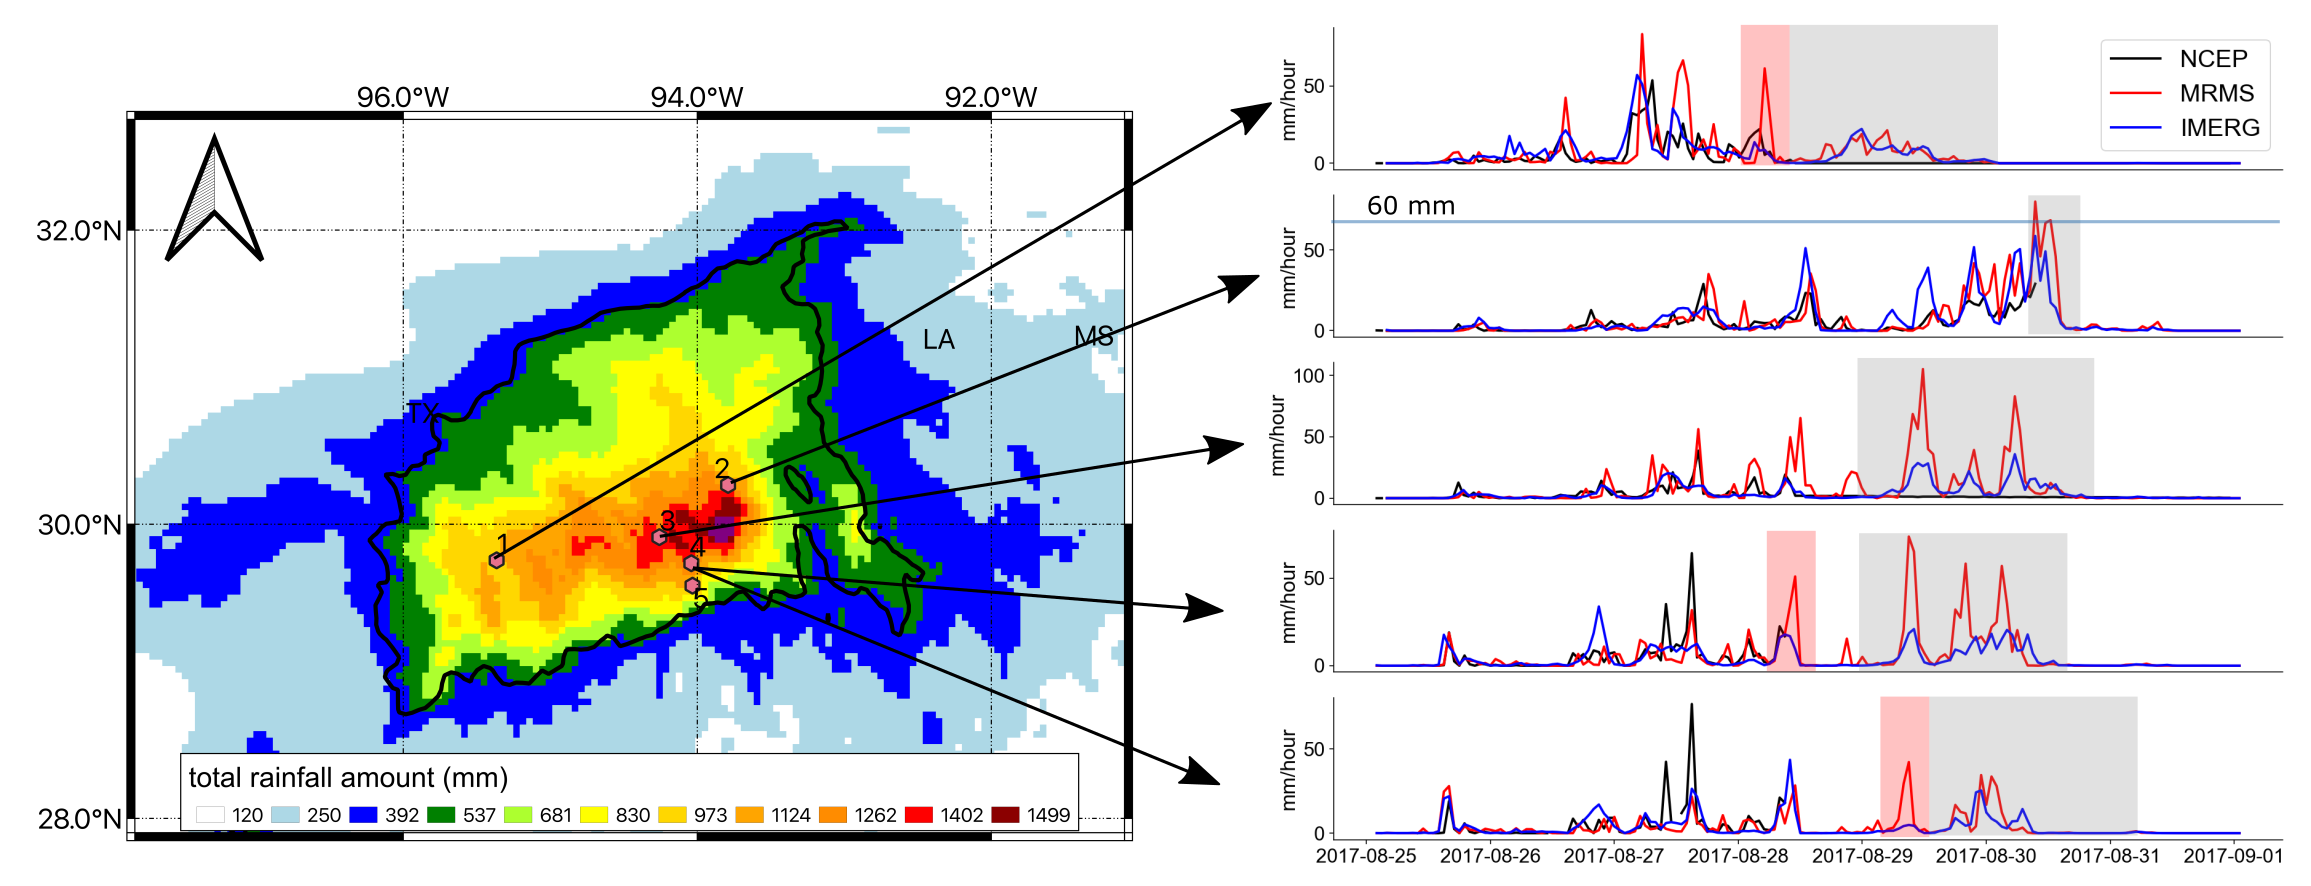
Fig.6 Time series plot of five selected pixels.